Chart files |


|
|
When we use the GDX Data Browser to generate a chart, it creates a simple text file. The file extension of this file is used to display the file as a chart. We can tell the IDE to open the file as a text file, using the PopUp menu, and select: Edit as text.
When we do this for the file ChartData.YearDataA.gch we see the following:
Note that only the name of the GDX file is present, not its full path. Using the filename only allows us to move chart files and corresponding GDX file, to a different GAMS project directory. The disadvantage of this approach is that we can only create charts using a GDX file that is stored in the project directory.
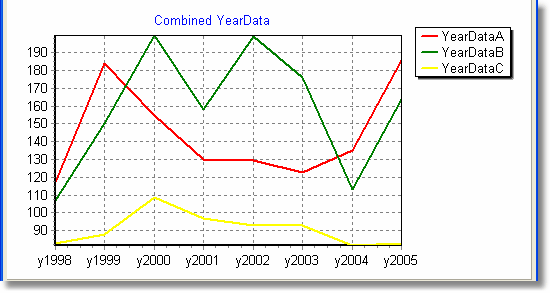
We can edit this file to combine three different symbols in the same GDX file and show the result on a single chart:
Save the file and reopen the file MainForm: File | Save followed by MainForm: File | ReOpen or using menu shortcuts Ctrl+S and Alt+R.
 Three symbols combined in a single chart
|