GDX data conventions for charts |


|
|
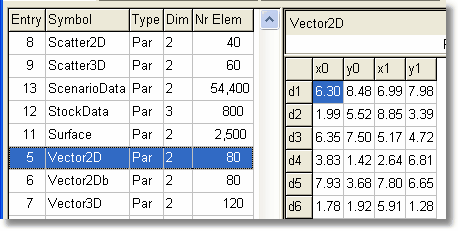
We have seen already that the number of dimensions shown in the data section of the GDX viewer determines what charts we can create. For a given dimension, the number of elements in the last dimension also determines what kind of chart we can create. For example, a 2D scatter chart requires a point (x0,y0) and a 2D vector chart requires a line (x0, y0) (x1, y1).
The table that follows summarizes the GDX file conventions for the various chart formats. It also includes the names used in the chart files for the TYPE parameter.
Note that the label names for the columns, like x0, y0 etc are arbitrary. The sequence of the labels is important however and this can be seen in the GDX data viewer.  GDX data convention for 2D vector
Note: Fan charts assume that the first time slot contains the probability for the scenarios. Probabilities have to be positive and their sum should equal one. For shapes, rectangle and ellipse, the legend and color are optional value. A non-zero value for the legend will draw the string of the place holder in the center of the shape. Color is codes as an RGB value. Reds in the range 0..255, Green in the range 256 * (0..255) and Blue 256 * 256 * (0..255) |